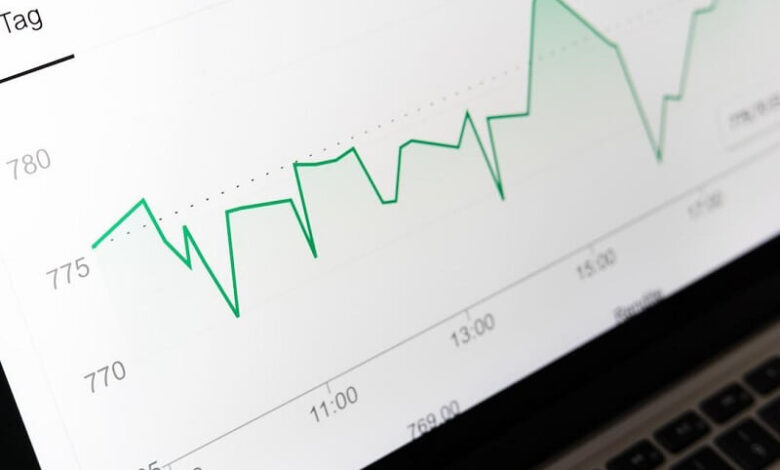
Data Visualization: Taking a Closer Look at the Line Chart
Data visualization is a crucial tool utilized by both businesses and academics to comprehend large amounts of complex data. While there are many methods, one of the most fundamental and widely used is the line chart. Understanding what a line chart is and how to read it effectively can provide valuable insights, helping you make informed decisions in a plethora of real-world scenarios. Keep reading to learn more about line charts.
Understanding Line Charts
Alt Text: A line chart highlights different data points in time
In the field of data visualization, the line chart has long been recognized for its simplicity and versatility. Plotting data points on a graph and connecting them with a straight line is a straightforward approach that provides an easy-to-follow visual representation of data over time.
While line charts may appear simple, interpreting them accurately demands a deep understanding of their inherent structure and function. They provide a way for viewers to track changes over time, illustrating trends and patterns in the data. This is why line charts have become an essential tool for researchers, business analysts, and anyone dealing with data.
Line charts can serve as a dynamic storytelling tool. By visually representing data, it allows viewers to immediately grasp complex information and draw conclusions. This fast processing capability can be particularly useful in time-critical sectors like finance and healthcare.
The art of data visualization is about more than just presenting raw figures. Each line chart embodies a story, narrating the tale of the data in a straightforward and beneficial manner that words alone cannot achieve.
The Importance of Line Charts in Data Analysis
In the realm of data analysis, line charts are invaluable. They provide an effective means to extract critical insights from extensive databases, facilitating simple yet comprehensive evaluations of data progression over time.
Moreover, line charts empower users to quickly identify peaks and troughs in datasets, helping them comprehend fluctuating trends. This capability can be instrumental in various scenarios, from evaluating stock performance to tracking disease spread over time.
Line charts enable users to compare different datasets on the same graph. This ability to assess multiple data groups simultaneously provides the opportunity to easily analyze relationships between different sets, such as the correlation between two variables, thereby enhancing data interpretation.
Despite the advent of more complex data visualization tools, the importance of line charts remains high due to their simplicity, efficiency, and versatility in showcasing chronological trends within any dataset.
Decoding Data with Line Charts

Alt Text: A line chart shows financial data over several years
Line charts find applications in myriad sectors, including business, academics, healthcare, and more. In business, for instance, line charts are widely used to track sales, revenue, and other financial data over time, providing valuable insights and assisting with data-driven decision-making.
In academia, line charts help researchers examine trends and correlations in their data, enhancing the relatability and comprehensibility of their research findings. Especially in fields like sociology and psychology, line charts can aid in understanding and predicting human behavior over time.
Regarding healthcare, line charts aid in monitoring patient health parameters, tracking disease spread, and understanding the efficacy of treatment methods. They also support epidemiologists in predicting future health trends and assessing the potential impacts of healthcare interventions.
In essence, the ability of line charts to represent complex data in a simple, accessible way makes it an indispensable tool across a wide gamut of real-world applications.
Mastering Line Charts
Becoming proficient in interpreting line charts goes beyond understanding their structure. It involves developing an understanding of the data being represented and recognizing long-term trends and patterns.
Refining your interpretation skills also includes understanding the influence of outliers on the overall data trend. An outlier can drastically influence the appearance of the data trend and mislead interpretations if not properly dealt with.
Furthermore, developing the ability to draw meaningful conclusions from multiple line chart comparisons can greatly enhance your data interpretation skills. It empowers you to understand relationships between different datasets and formulate educated predictions.
Altogether, line charts are an essential data visualization tool used across multiple fields. Their ability to represent time series data effectively makes them critical for data analysis, business strategy, weather forecasting, scientific research, and even education. The power of line charts lies not just in their simplicity but also in their ability to transform complex data sets into understandable and actionable knowledge.


